

Learning how to use Power BI is fairly easy, and if you’re lucky, the built-in features will provide everything you need to produce professional dashboards for end users. However, you’ll get more out of the program if you learn Data Analysis Expressions. DAX is a collection of functions, operators and constants that you can use in expressions. It’s powerful, yet easy to learn.
SEE: Hiring kit: Microsoft Power BI developer (TechRepublic Premium)
In this tutorial, you’ll learn conceptual basics and syntax rules for writing DAX expressions. We’ll also work through a simple example. If you’re following along, I’m using Power BI Desktop on a Windows 10 64-bit system.
You can download the Microsoft Power BI demo file for this tutorial.
Jump to:
As a Power BI designer, you’ll want end users to get all the insights they need from what you create. Occasionally, that means using DAX, a set of functions that evaluate data to return meaningful information.
Most Power BI designers are familiar with writing expressions, and this skillset is especially helpful when learning DAX. If you’re familiar with Microsoft Excel functions, you’re in luck, because DAX and Excel functions are similar.
SEE: The Complete Microsoft Power BI Super Bundle (TechRepublic Academy)
Even if you have no experience with expressions, you can still learn to use DAX. The first step is to understand how to “speak” DAX. That requires learning a set of basic grammatical rules, or syntax.
In English, you might say: “I want to sum all of the sales values for the year 2021.” Power BI can’t interpret that request. To make DAX work for you, pretend that you’re learning a foreign language; in a sense, that’s exactly what you’re doing, just with a language of functions, arguments and Power BI context.
Functions are predefined instructions for evaluating values that you supply. There are several categories: Date and Time, Time Intelligence, Information, Logical, Mathematical, Statistical, Text, Parent/Child and more.
Although most functions return values, you can also return a table. Functions always reference a table or column, but you can apply filters to refer to specific rows.
Arguments allow you to pass specific values to the function for evaluation. Arguments can be another function, an expression, a column reference, a set of values or text, logical values such as TRUE and FALSE, and constants, giving context to the request.
Before we can move on to examples, we need to discuss context, which allows you to express whether you’re dealing with rows or filtered results, as follows:
Now you’re ready to put some of this newfound knowledge to work by writing a DAX expression in the form of a measure.
Power BI provides a number of implicit measures, which are predefined calculations in DAX. You’ll always want to check what’s available before writing your own to save yourself time and effort. When nothing’s available, you’ll need to write a model or explicit measure.
Why are we starting you out with a measure? Because it’s the easiest way to get started and, most likely, it’s the way you’ll solve most custom calculation needs.
Using the simple dataset shown in Figure A, let’s write a measure that returns a year-to-date value for each record. This simple .pbix file uses the Date table in the Fields pane as the Date table.
Figure A
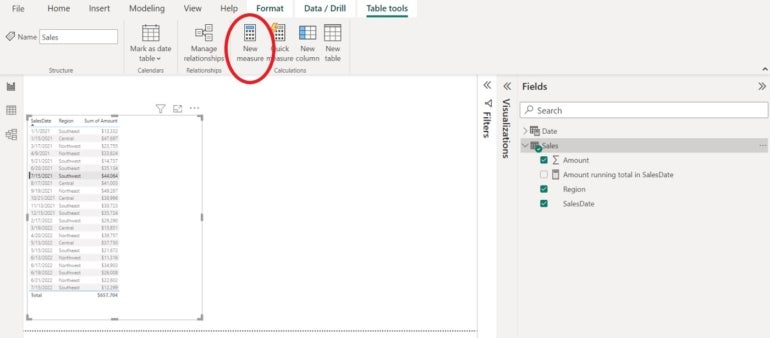
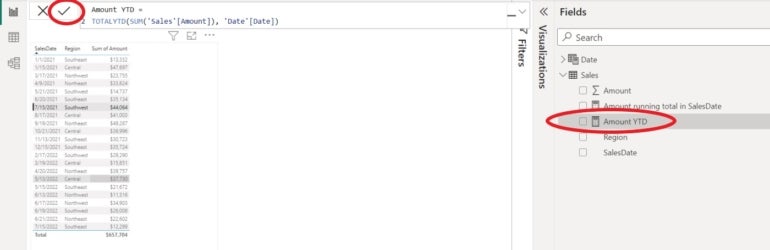
To start, select the Sales table in the Fields pane and then click New Measure on the contextual Table Tools tab in the Calculations group. Power BI will enter Measure = in the resulting formula bar. Replace it with the following DAX expression, as shown in Figure B:
Amount YTD =
TOTALYTD(SUM('Sales'[Amount]), 'Date'[Date])
Figure B

Power BI adds a measure named Measure to the Sales table but doesn’t commit it just yet. Let’s look at this DAX expression by its individual elements:
Now, let’s look at the syntax so you know what’s expected for DAX to interpret and calculate the results you need.
The TOTALYTD function uses the following syntax:
TOTALYTD(<expression>,<dates>[,<filter>][,<year_end_date>])
As mentioned, TOTALYTD is a DAX function that evaluates year-to-date values of <expression> within the current (row) context. Now, let’s look at the arguments:
Now, let’s look at the DAX Sum function, which sums the values in a column using the syntax
SUM(<column>)
The only argument, column, identifies the column to total.
Now, let’s take a look at some other requirements:
With all of this new information in mind, can you express
Amount YTD =
TOTALYTD(SUM('Sales'[Amount]), 'Date'[Date])
in English?
In English, this DAX expression says: “Return the sum of the Amount column in the Sales table, using the date values in the Date table’s Date column to determine the year.” In short, you’ve written an expression, using two DAX functions, that returns a running total by the year.
Now, you’re ready to commit the expression as a measure that you can add to a visualization. To do so, click the checkmark to the left of the formula bar. Doing so will update the name Measure in the Fields pane list to Amount YTD, as shown in Figure C. If you get an error, review the expression and correct any typos.
Figure C
Earlier, I mentioned that Date is a date table. If you’re not familiar with date tables, don’t worry. Power BI does a good job of handling dates internally. However, if you’d like to learn more, read the following articles:
To learn more about Power BI measures, you can read these articles:
Now, let’s see how the DAX expression written as a measure works.
Adding the measure doesn’t do much of anything. Power BI updates the name of the measure in the Fields pane, but you have to manually add it to a visualization to see how it works. Let’s do that now, using the simple Table visualization shown in the figures.
To do so, click the Table visualization to select it. Then, check the Amount YTD measure. Doing so adds it to the visualization, as you can see in Figure D.
Figure D
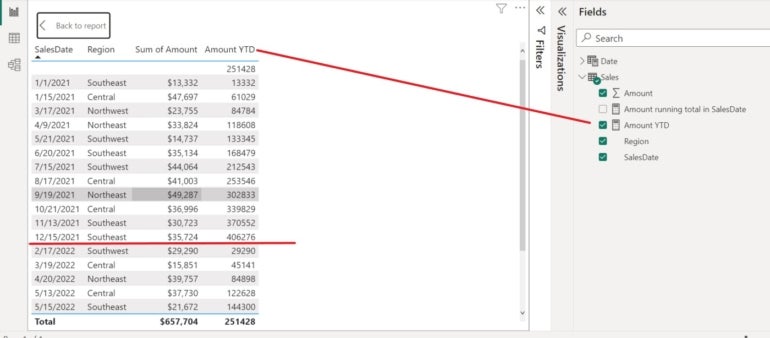
We know that the SUM function totals the values in the Sum of Amount column. That’s the name Power BI gives the Amount column when it’s used in a visualization because it’s a column that can be used in mathematical evaluations. You can change it in the visualization if you’d like, but the values you’re seeing are literal values from the Amount column for now. There’s no summing going on in that column.
The TOTALYTD’s first argument is the SUM function that’s summing the Amount column in the Sales table. The second argument tells Power BI to start a new total when the year in that column changes. Notice what happens between the two dates, 12/15/2021 and 2/17/2022. The latter date is in a new year, so the total starts over. That’s an internal instruction, so you don’t have to write any code to make it happen.
I have a surprise for you, though. You don’t have to write your own year-to-date expression, because Power BI has a quick measure that does the same thing. All you have to do is identify the arguments: The tables and columns.
One of the easiest ways to learn how to use DAX is to explore quick measures. Simply explore the interface (Table Tools tab) and enter several. When you see a function or syntax you don’t understand, you can use a search engine to learn more.
SEE: Quick glossary: Business intelligence and analytics (TechRepublic Premium)
Sometimes, there’s no other way to get the results you need without implementing DAX. Now that you know a bit about DAX, its syntax and a few of its functions, you’re ready to start writing expressions on your own.
Read next: Best business intelligence tools (TechRepublic)
24World Media does not take any responsibility of the information you see on this page. The content this page contains is from independent third-party content provider. If you have any concerns regarding the content, please free to write us here: contact@24worldmedia.com